

TL;DR
- Secondary sales automation ROI is measured across six metrics: data latency, stockout rate, forecast accuracy, field-rep productive time, scheme leakage recovered, and days sales outstanding.
- The dollars live in the extraction and reconciliation layer, not the dashboard. A slick dashboard on unreconciled distributor data reports numbers that are wrong within a week.
- Cutting data latency from weeks to a day is the unlock: distributors typically report monthly, and field teams cannot fix a stockout they learn about 30 days late.
- Concrete drivers to model: up to 30% fewer stockouts, 4-7% of monthly throughput recovered from blind-spot lost sales, and 1-3% of revenue lost to trade-scheme leakage that reconciliation claws back.
- Build the ROI case bottom-up: baseline each metric before rollout, attach a rupee value per point of movement, and hold the number against reconciled sell-out, not sell-in.
The ROI on secondary sales automation shows up in six places: how fast you see sell-out data, how often outlets go out of stock, how accurate your forecasts get, how much of a rep’s day is productive selling, how much trade-scheme money leaks, and how quickly cash comes back. Get those six moving and the investment pays for itself in a quarter or two. Measure the dashboard instead, and you will struggle to prove anything.
We build the extraction and reconciliation layer under these systems, so we see which numbers hold up in a board review and which ones fall apart. The pattern is consistent. Teams buy the field app, launch the dashboard, and then cannot answer the one question a CFO asks: what did this earn us? This piece gives you the metrics that answer it.
What actually proves ROI on secondary sales automation?
Six metrics prove it, and each maps to a rupee value. Data latency and stockout rate drive recovered revenue. Forecast accuracy drives working-capital efficiency. Field-rep productive time drives coverage. Scheme leakage and days sales outstanding drive cash. Track these, not vanity counts like app logins or reports generated.
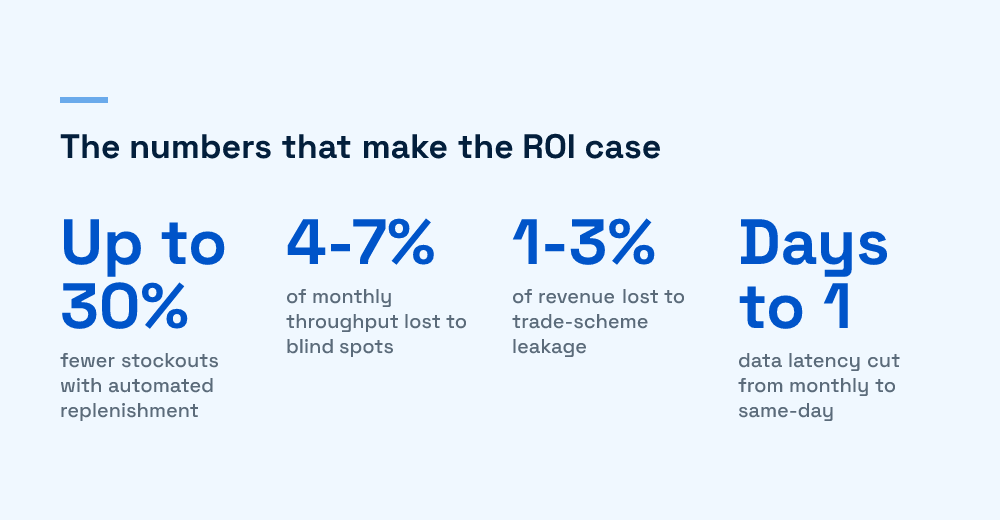
The numbers below are industry and vendor estimates, so treat them as ranges to test against your own baseline, not guarantees. What matters is that each one is measurable before and after rollout.
The revenue metrics
- Data latency. In practice distributors report weekly or monthly, too slow for daily execution fixes. Automation moves this toward same-day capture, which is the whole point of secondary sales tracking software. Latency is the metric everything else depends on.
- Stockout rate. AI-led replenishment and expiry alerts can cut stockouts by up to 30%. Every avoided out-of-stock at a fast-moving outlet is recovered sell-out.
- Blind-spot lost sales. Lost sales from distributor blind spots run an estimated 4-7% of monthly throughput. Visibility is what closes that gap.
The efficiency and cash metrics
- Forecast accuracy. Reliable sell-out history feeds better replenishment, which trims both stockouts and dead stock.
- Field-rep productive time. Automating order capture and reporting shifts hours from admin back to selling, which typically shows up as wider outlet coverage per rep with sales-force automation in CPG. Measure it as productive visits per rep, not app logins.
- Scheme leakage and DSO. Trade-scheme leakage and slow cash cycles are where finance feels the pain, covered below.
Why does the ROI live in the extraction layer, not the dashboard?
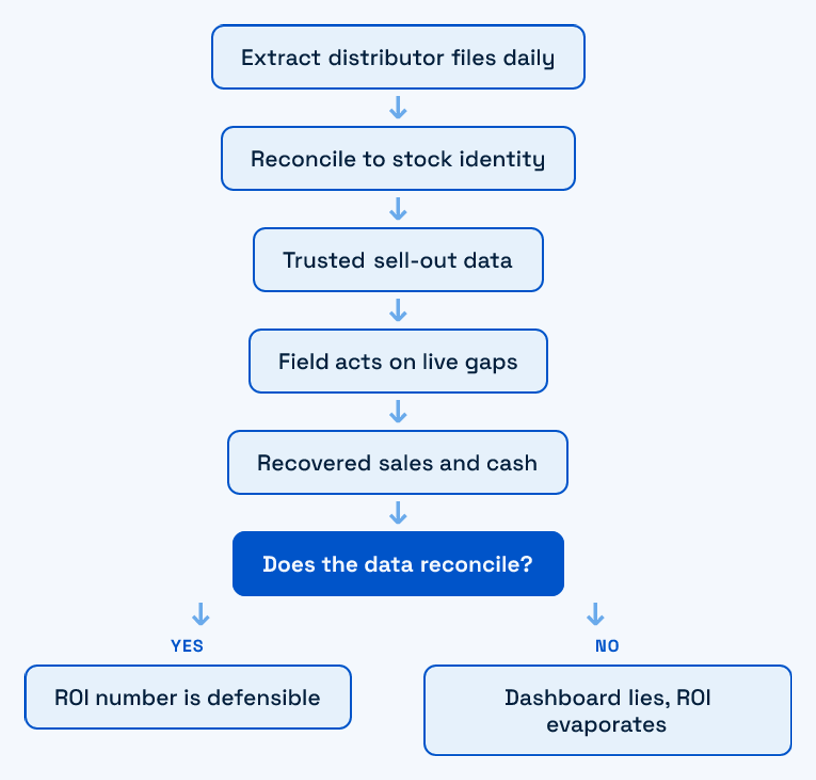
Because a dashboard only reports what the data underneath it says, and secondary sales data arrives broken. Distributor exports come in dozens of file formats that drift constantly, and if you do not parse and reconcile them correctly, the dashboard confidently shows numbers that are wrong. The chart looks fine. The decision it drives is not.
This is the same failure we describe in why enterprise document AI fails at the extraction layer. The model is rarely the problem. The wiring is. The way we handle the ingestion mess itself is the subject of automating secondary sales extraction across file formats, and it is worth understanding before you attribute any ROI to a reporting tool.
The test for whether your data can carry an ROI claim is the stock identity: opening plus purchases minus sales minus returns should equal closing. If it does not reconcile, the sell-out figure is a guess. We break down where that reconciliation snaps in the pharma pipeline teardown and the deeper pipeline architecture failures. Both matter because the reconciliation layer is exactly what your ROI number rests on.
Which metrics should you measure, and how?
Each metric needs a defined measurement method and a baseline captured before rollout. Without the baseline, you have an after with no before, and no honest ROI. Here is the mapping we use with clients.
| Metric | How to measure it | ROI it proves |
|---|---|---|
| Data latency | Days between a sale at the retailer and that record landing in your system | Speed of every downstream decision |
| Stockout rate | Percent of outlet-SKU combinations out of stock on visit | Recovered sell-out revenue |
| Forecast accuracy | Forecast versus actual sell-out, by SKU and region (MAPE) | Lower dead stock and fewer stockouts |
| Rep productive time | Productive visits and admin minutes per rep per day | Coverage without headcount growth |
| Scheme leakage | Planned scheme spend versus verified claims paid | Recovered trade-spend budget |
| DSO | Days from invoice raised to cash collected | Freed working capital |
Two of these deserve extra care. Forecast accuracy only means something when it runs on reconciled sell-out, since forecasting off sell-in just models your own shipping pattern, not real demand. That distinction is the whole point of primary versus secondary sales data at the last mile.
The scheme leakage number finance cares about
Trade promotions are often the second-largest line on a CPG P&L, and a lot of it leaks. Estimates put promotion leakage at 1-3% of annual revenue, and field practitioners commonly estimate that 30% or more of trade-promo spend fails to produce verifiable impact at the outlet, through unverified claims and duplicate submissions. Automated claim validation against reconciled secondary sales is what recovers it. On a large promo budget this is usually one of the most defensible numbers in the whole ROI case.
How do you build the ROI case for a distributed field force?
Build it bottom-up from baselines, attach a value to each point of movement, and defend it against reconciled data. A distributed field force adds one wrinkle: adoption. A metric that only moves at your three pilot distributors is not ROI, it is a demo. Model these steps in order.
- Baseline every metric first. Capture latency, stockout rate, leakage, and DSO before a single app goes live. This is the number you will be held to.
- Attach a rupee value per point. One point of stockout reduction, one day off DSO, one percent of leakage recovered: price each so the model speaks in cash.
- Weight it by adoption. Multiply expected gains by realistic field usage. Roughly 60% of field-automation rollouts stall on adoption, not features, so a plan that assumes 100% is fiction.
- Reconcile before you report. Any gain measured on unreconciled data gets discounted to zero in a serious review.
The build-versus-buy choice shapes the cost side of this equation, because maintenance, not licences, is where custom builds get expensive. We lay that trade-off out in build vs buy for a secondary sales automation stack. For the full picture of how the pieces fit, the complete guide to secondary sales automation is the place to start.
The honest summary: the technology to show a pretty dashboard is cheap and everywhere. The engineering to make the number under it true is where the ROI actually comes from, and it is the part most projects underfund. Spend there.
If you are trying to put a defensible number on a secondary sales rollout and the data underneath keeps failing to reconcile, that is the problem we work on. Start with a conversation, no pitch.
Frequently Asked Questions
How long does secondary sales automation take to pay back?
Vendor estimates range from a few weeks for basic order-error and route savings to three to nine months for a fuller distributor-management deployment. The honest answer depends on your baseline. If you are losing 4-7% of throughput to blind spots and a few percent of revenue to promotion leakage, payback is fast. If those numbers are already tight, it is slower. Model it from your own baselines rather than a vendor’s headline figure.
What is the single most important metric to track?
Data latency, the time between a retailer sale and that record appearing in your system. Every other metric depends on it. A field team cannot fix a stockout, redirect a scheme, or correct a forecast off data that is three weeks old. Cutting latency from monthly to same-day is the unlock that makes the other five metrics improvable at all.
Why can’t I just measure ROI from my dashboard’s numbers?
Because the dashboard reports whatever the data underneath it says, and secondary sales data arrives in inconsistent distributor formats that must be parsed and reconciled first. If the underlying records do not satisfy the stock identity of opening plus purchases minus sales minus returns equals closing, the sell-out figure is an estimate dressed as fact. Reconcile first, then trust the chart.
How is ROI different for pharma versus FMCG secondary sales?
The metrics are the same, but pharma adds batch and expiry tracking, stricter reconciliation, and stockist data that fragments differently from FMCG distributor exports. Expiry-driven write-offs become a material ROI line that most FMCG models ignore. The extraction layer also tends to be harder, so the reconciliation savings are proportionally larger.

Huzefa Motiwala
Huzefa Motiwala is a co-founder of AlterSquare, an application-layer partner that helps SaaS and tech-led companies stabilise, modernise, and extend complex systems without breaking what already works. He comes at software from design and frontend, with a focus on data-heavy interfaces and on getting real teams to actually adopt what gets built — not just ship it. He writes about working in fragile, high-stakes codebases: incremental change over risky rewrites, UX and technical debt, and embedding AI into real workflows.




Leave a Reply