

When your frontend app starts lagging, it’s not just annoying – it’s costly. Users expect pages to load in under 3 seconds, and delays can lead to higher bounce rates and lost revenue. The main culprits? Bloated JavaScript bundles, inefficient state management, and outdated architecture.
Key takeaways:
- Heavy JavaScript: Large bundles increase load times, especially on mobile.
- Poor rendering practices: Inefficient updates cause stuttering and lag.
- Technical debt: Early design decisions often lead to bottlenecks as apps grow.
To fix these issues, focus on:
- Reducing bundle size: Use code splitting, tree shaking, and modern compression methods.
- Optimizing rendering: Virtualize lists, manage state efficiently, and avoid layout thrashing.
- Modernizing architecture: Adopt server-side rendering or static site generation to improve responsiveness.
Tools like Lighthouse, Webpack Bundle Analyzer, and Real User Monitoring (RUM) can help identify and resolve performance bottlenecks. Fixing slowdowns isn’t just about speed – it’s about keeping users engaged and boosting conversions.
Frontend System Design: The 2025 Web Performance Roadmap
Why Large Frontend Applications Slow Down
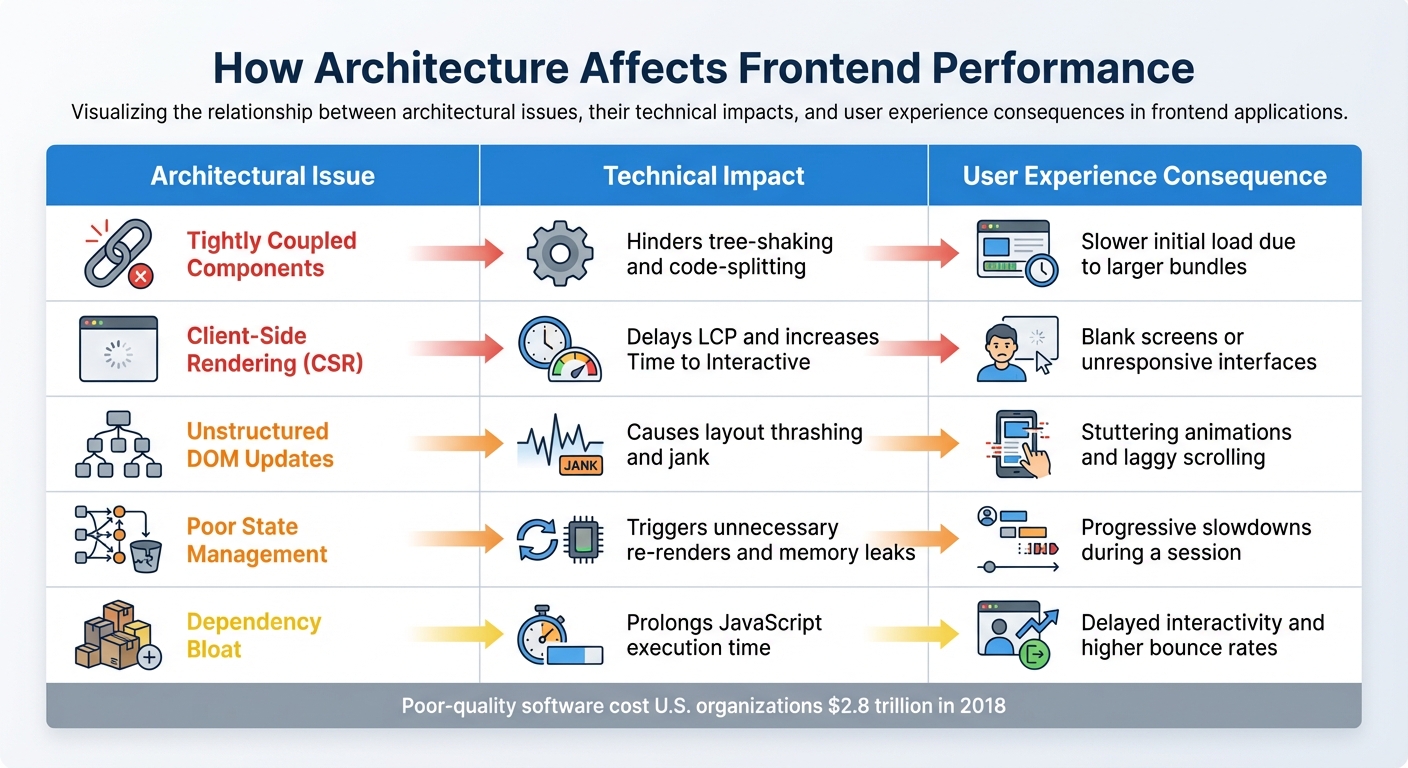
Frontend Performance Issues: Architectural Problems, Technical Impact, and User Experience Consequences
Let’s break down the main technical reasons why large frontend applications often struggle with performance. The culprits? Bloated code bundles, inefficient rendering practices, and architectural decisions that don’t age well.
Oversized JavaScript Bundles and Assets
JavaScript poses a unique challenge because it’s render-blocking. Browsers operate on a single thread, so they can’t handle other rendering tasks until the JavaScript has been downloaded, parsed, and executed [7]. Unlike images, JavaScript also has an execution cost, which can consume between 10% and 30% of the total page load time [7]. On mid-range mobile devices, this process can take up to four times longer [10].
The situation worsens with request waterfalls. When files are deeply nested (e.g., Main.js → Component → Utils → Data), each dependency must be processed before the next can load [12]. Large scripts can lead to "long tasks" (over 50 ms), blocking the main thread and making the browser unresponsive to user actions [11].
"It’s not well known, but whitespace removal and symbol mangling accounts for 95% of size reduction in minified code for most JavaScript – not elaborate code transforms."
– Rowan Oulton, Staff Engineer, Slack [13]
Slack tackled this issue in 2018 by slashing their median build time from 170 seconds to just 17 seconds. How? They parallelized loaders using HappyPack, skipped costly compression transforms in UglifyJS (keeping mangling), and introduced a manifest chunk to stabilize module IDs [13].
Dynamic asset injection adds to the problem. When assets like images are injected via JavaScript or used as CSS backgrounds, the browser’s preload scanner might not detect them in time, delaying the Largest Contentful Paint (LCP). About 35% of mobile websites have an LCP element that isn’t immediately discoverable in the initial HTML [10]. To hit a "good" LCP (under 2.5 seconds) on a Fast 3G network, uncompressed LCP images should ideally be around 144 KB [11]. Yet, 16% of mobile sites mismanage lazy-loading for these critical images, pushing back the display of essential content [10].
Next, let’s dive into how inefficient state management makes these problems even worse.
Poor State Management and Rendering
Beyond bloated bundles, how your app handles state can directly impact responsiveness. Poor state management can lead to long JavaScript tasks that monopolize the main thread, causing the interface to freeze and leaving user clicks or taps unregistered.
In large apps, overly complex or poorly designed state systems can trigger unnecessary re-renders. If state updates aren’t scoped well, even a small change can force the browser to repaint large parts of the page. This becomes a bigger issue as the DOM grows. For instance, layout thrashing happens when JavaScript repeatedly reads layout properties (like offsetHeight) and writes to the DOM in a loop, causing constant recalculations [6]. Apps dealing with massive datasets – like grids or long lists – often lag when trying to render everything at once instead of using techniques like virtual scrolling.
The industry’s shift from First Input Delay (FID) to Interaction to Next Paint (INP) has highlighted these challenges. In 2024, only 43% of mobile sites achieved "good" scores across all Core Web Vitals, and Next.js sites saw a 10% drop in "good" scores with this metric change [10]. Fully client-side rendering also drags down LCP scores when more than 70% of the page’s content is generated on the client side [10].
Outdated or Unstructured Architecture
Finally, architectural decisions play a huge role in performance. As projects grow, early decisions can turn into long-term technical debt. Tightly coupled logic makes it harder to isolate and fix issues, while unstructured code can lead to excessive DOM manipulation, inefficient event handling, and memory leaks.
Older client-side rendering patterns are especially problematic for metrics like LCP and INP [10]. Poorly organized architectures can cause forced synchronous layouts, where JavaScript continuously reads and writes to the DOM in the same frame – forcing the browser to recalculate positions and sizes [6]. A bloated DOM only worsens the delay in the Critical Rendering Path [8].
Dependency bloat is another major issue. Using unoptimized third-party libraries – or even entire frameworks for small features – adds to JavaScript execution time [9]. Inconsistent component lifecycles and poorly managed variables can also lead to memory leaks, draining system resources and eventually causing slowdowns or crashes [14][15].
| Architectural Issue | Technical Impact | User Experience Consequence |
|---|---|---|
| Tightly Coupled Components | Hinders tree-shaking and code-splitting | Slower initial load due to larger bundles |
| Client-Side Rendering (CSR) | Delays LCP and increases Time to Interactive | Blank screens or unresponsive interfaces |
| Unstructured DOM Updates | Causes layout thrashing and jank | Stuttering animations and laggy scrolling |
| Poor State Management | Triggers unnecessary re-renders and memory leaks | Progressive slowdowns during a session |
| Dependency Bloat | Prolongs JavaScript execution time | Delayed interactivity and higher bounce rates |
In 2018, poor-quality software cost U.S. organizations an estimated $2.8 trillion [14]. As apps become more complex with real-time updates and advanced visualizations, keeping performance in check is only getting harder [2]. And with the gap between high-end and low-end devices widening, addressing these architectural pitfalls is more urgent than ever.
How to Identify Performance Problems
Once you’ve pinpointed the causes of slowdowns, the next step is identifying the specific performance bottlenecks. This requires gathering solid data, and modern browser tools make it easier than ever to do just that.
Measure Performance with Browser Tools
Start by focusing on Core Web Vitals: Largest Contentful Paint (LCP), Cumulative Layout Shift (CLS), and Interaction to Next Paint (INP). These metrics are key indicators of user experience and can highlight inefficiencies. For a smooth experience, aim for an LCP under 2.5 seconds and a First Contentful Paint (FCP) under 1.8 seconds [18]. Tools like Lighthouse, built into Chrome DevTools, are invaluable here. Lighthouse not only provides performance scores but also offers actionable tips for improving performance, accessibility, and SEO [21].
For ongoing monitoring, consider integrating Lighthouse CI into your continuous integration pipeline. This helps catch performance issues before they make it to production [21]. If you’re looking for real-world data, Real User Monitoring (RUM) tools like Sematext Experience (starting at $9/month) or LogRocket (starting at $99/month) can track actual user experiences across devices and networks [19]. While synthetic monitoring works in controlled environments, RUM provides insights into how your site performs under real-world conditions [16][17].
Pay close attention to INP, especially in Single Page Applications. INP, which replaced First Input Delay (FID) as a Core Web Vital in 2024, measures how quickly your page responds to user interactions after it has loaded [16][29]. To dig deeper, use Chrome’s Long Animation Frames API to identify scripts causing delays in interactions [16].
Analyze Bundle Size and Dependencies
Bloated bundles often drag down performance. Tools like Webpack Bundle Analyzer and Rollup Plugin Visualizer can create treemaps that reveal which packages are inflating your bundle size [22][23]. By examining these maps, you can pinpoint oversized packages and fine-tune your imports [22].
For example, in April 2025, a DeveloperWay project reduced its bundle size from 5.3 MB to 878 KB by identifying inefficiencies like wildcard imports of the entire MUI icon set (2,000+ icons) and replacing non-tree-shakable Lodash imports with specific ones [22]. The difference between tree-shakable and non-tree-shakable libraries is stark. In one Angular application, MomentJS accounted for 64.8% of the total bundle size, while date-fns, a tree-shakable library, added only 10% [24].
Other tools like BundlePhobia and the Import Cost plugin can help uncover hidden dependency costs before they’re merged into your codebase [23][26]. For instance, instead of using import { Star } from '@mui/icons-material', opt for import Star from '@mui/icons-material/Star' to include only the necessary code [22]. To avoid regressions, set hard limits in your CI/CD pipeline, such as keeping JavaScript bundles under 200 KB or ensuring Total Blocking Time stays below 200ms [25].
After optimizing your bundle, the next step is to profile runtime performance to identify script execution issues.
Profile Runtime Performance
To find the root causes of runtime issues, head to Chrome DevTools’ Performance panel. Use CPU throttling (4x–6x) to simulate mid-range or mobile devices, and keep an eye out for red triangles in the "Main" section, which flag tasks taking longer than 50ms and blocking the main thread [27][30].
The flame chart in the "Main" thread is a powerful tool for diagnosing problems. Wider bars indicate longer-running functions, while stacked bars show the hierarchy of function calls [27]. Pay special attention to purple "Layout" events – large or frequent purple blocks often signal "forced reflows", where JavaScript forces the browser to repeatedly recalculate styles and layouts [27][30].
For live interactions, enable the FPS meter using the "Show Rendering" command in DevTools to spot frame drops. To reduce unnecessary rendering, apply the CSS property content-visibility: auto to off-screen elements, allowing the browser to delay rendering until the user scrolls near them [29]. Keep in mind that 53% of mobile users will abandon a page if it takes more than 3 seconds to load [28][29], and just a 1-second delay in page load time can lead to a 7% drop in conversions [28].
sbb-itb-51b9a02
How to Fix and Prevent Frontend Slowdowns
Once you’ve pinpointed the causes of slowdowns, the next step is tackling them head-on. Optimizing these bottlenecks can significantly improve performance. For example, mobile users who experience faster load times generate 17% more revenue per session compared to the average user [11]. To gain a competitive edge, your site needs to be at least 20% faster in measurable metrics than your competitors [11].
Reduce Bundle and Asset Size
Start by using code splitting to break your application into smaller chunks that load only when necessary. Tools like Webpack or Vite simplify this process, allowing you to divide your codebase by route or feature [31][20][32]. Dynamic imports (import()) can further reduce the time to interact (TTI) by loading modules on demand [31][32].
Next, implement tree shaking with ES6 module syntax (import/export). This removes unused code, slimming down your final bundle [31][20][32].
On the server side, enable Brotli or Gzip compression to shrink text-based resources by up to 80% [3][32]. For images, switch to modern formats like WebP or AVIF, use responsive images with the <picture> element, and enable native lazy loading with loading="lazy" [3][9][10]. Keep critical images small to improve Largest Contentful Paint (LCP) scores [11].
Strategically apply resource hints: use preload for high-priority assets like fonts or above-the-fold scripts, and prefetch for resources needed later [31][20][3]. For LCP images, consider fetchpriority=high. Adoption of this attribute on mobile sites rose from 0.03% in 2022 to 15% in 2024, thanks to updates in platforms like WordPress [10]. Avoid using CSS background images for LCP elements, as browsers can’t discover these resources until the CSS is fully parsed [10].
Lastly, set performance budgets and enforce them during development. For example, limit JavaScript bundles to under 200KB and keep Total Blocking Time below 200ms [11]. Tools like bundlesize or Lighthouse CI can help catch performance issues before deployment [11].
Improve Rendering and State Updates
Once your bundles are optimized, turn your attention to rendering and managing state efficiently. For applications handling large datasets, list virtualization is invaluable. Libraries like react-window or react-virtualized only render items currently visible in the viewport, reducing memory usage and DOM complexity [2][5].
Use Web Workers to handle heavy computations off the main thread [5][1][9]. Break tasks into smaller chunks using requestIdleCallback or setTimeout to avoid blocking the UI [5].
Optimize data fetching by using GraphQL or tRPC to avoid over-fetching, ensuring your application state holds only the data it needs [5]. For multiple asynchronous requests, use Promise.all to run them in parallel, cutting down on total wait times [1].
Pay attention to memory management. Memory leaks can arise from uncleaned event listeners, long-running timers, or unreleased object references [5]. Always clean up event listeners in React’s componentWillUnmount or useEffect cleanup functions to prevent unnecessary memory usage [5].
For rendering optimizations, leverage the Intersection Observer API to trigger animations or load components only when they enter the viewport [33]. Replace inefficient nested loops (O(n²) complexity) with Map or Set lookups (O(n) complexity) to process large datasets significantly faster [5]. Batch DOM updates with requestAnimationFrame to prevent layout thrashing and ensure smoother animations [9].
Update Your Frontend Architecture
Optimizing assets and rendering is just one part of the equation – modernizing your architecture ensures long-term performance improvements. As your application scales, adopting a layered architecture with clear module boundaries can simplify debugging and make refactoring easier [1]. This approach allows you to upgrade parts of your codebase incrementally instead of rewriting it all at once.
Consider using Server-Side Rendering (SSR) or Static Site Generation (SSG) with frameworks like Next.js. These methods improve Interaction to Next Paint (INP) and initial load times, outperforming client-side rendering [2][10]. With INP replacing First Input Delay (FID) as a Core Web Vital in 2024, responsiveness throughout the user session is now more critical than ever [10].
For distributed systems, optimize inter-service communication with asynchronous, non-blocking requests. Use session objects to maintain persistent connections and reduce network overhead [1]. Regularly audit third-party scripts and load them asynchronously using async or defer to prevent them from blocking the main thread [9].
Finally, automate performance testing by integrating tools like JMeter, k6, or Lighthouse into your CI/CD pipeline. This proactive approach can catch issues before they go live [35][4]. In 2023, 94% of users reported less reliable applications and websites compared to the previous year, and the U.S. incurred $2.41 trillion in costs due to poor software quality in 2022 [35]. As Dmitry Bastron aptly puts it:
"Performance is not a feature; it is a foundational requirement, as critical as security, accessibility, or functional correctness" [34].
Conclusion
Large frontend applications often face performance challenges due to bloated code, inefficient state management, and outdated architectures. If left unresolved, these issues can significantly impact the user experience. Tackling performance concerns early can help sidestep many of these common hurdles.
To keep your app running smoothly, set clear performance budgets and integrate tools like Lighthouse and Webpack Bundle Analyzer into your CI/CD pipeline. These tools help minimize bundle sizes and ensure responsiveness. Techniques like code splitting, tree shaking, list virtualization, and leveraging Web Workers can also maintain speed as your application grows. Updating your architecture to modern standards further ensures long-term reliability and scalability.
When your team is already stretched thin, resolving these performance bottlenecks can feel overwhelming. That’s where AlterSquare comes in. They specialize in performance audits, architecture upgrades, and engineering support tailored for scaling startups. Whether you need help pinpointing bottlenecks, transitioning to a newer framework, or expanding your team with skilled engineers, AlterSquare offers the expertise and strategic guidance to keep your app fast and competitive.
Don’t wait – deliver the seamless experience your users expect today.
FAQs
What are the best ways to reduce the size of JavaScript bundles in a large frontend application?
To make your JavaScript bundles smaller, start by implementing code splitting with dynamic imports. This approach ensures that only the code you need is loaded at the right time, keeping things efficient. Another key technique is tree-shaking, which helps you get rid of unused code and ensures you’re importing just what your application actually uses.
Don’t forget to minify your code and enable compression during the build process – both are great ways to further reduce file sizes. Lastly, take a close look at your dependencies. Identify any that are unnecessary or excessively large and remove them. These strategies can go a long way in boosting both performance and maintainability.
How can I optimize state management to keep my app running smoothly?
To keep your app running smoothly and handle state effectively, consider using centralized state management tools like Redux or Vuex. These libraries simplify how you manage state, making your app less complex and more organized. A good practice is to normalize your state structure, which makes your data easier to access and update. Pair this with selectors to fetch only the exact data your components need, avoiding unnecessary overhead.
To further boost performance, reduce redundant re-renders by incorporating memoization techniques. For example, in React, you can use useMemo, or turn to libraries like reselect. These methods ensure your app focuses only on the critical tasks, helping it stay quick and responsive, even as it scales up.
How can updating frontend architecture prevent performance issues in large applications?
Modernizing your frontend architecture isn’t just a technical upgrade – it’s a game-changer for performance. By streamlining complex codebases, fine-tuning rendering processes, and minimizing unnecessary reflows, you can create a faster, more responsive application that remains easy to manage as it grows.
Some effective strategies include using efficient state management, code splitting, and lazy loading. These techniques work together to cut down load times and deliver a smoother user experience. On top of that, leveraging modern frameworks like React or Vue helps keep your application scalable and aligned with current development trends, reducing the risk of long-term technical challenges or sluggish performance.
Related Blog Posts
- Building Construction Software with Vue.js: Why We Choose It for Complex Applications
- Handling Large IFC Files in Web Applications: Performance Optimization Guide
- Construction Software Architecture: Microservices vs Monolith Performance Test
- Why We Ditched React for Vue: The Developer Happiness Metrics That Shocked Us


Leave a Reply