
Primary vs Secondary Sales Data: Why the Last Mile Is the Hardest to Capture in Distribution
Huzefa Motiwala July 3, 2026
TL;DR
- Primary (sell-in) data comes from your own ERP; secondary (sell-out) lives in distributor systems, and only sell-out tracks real demand.
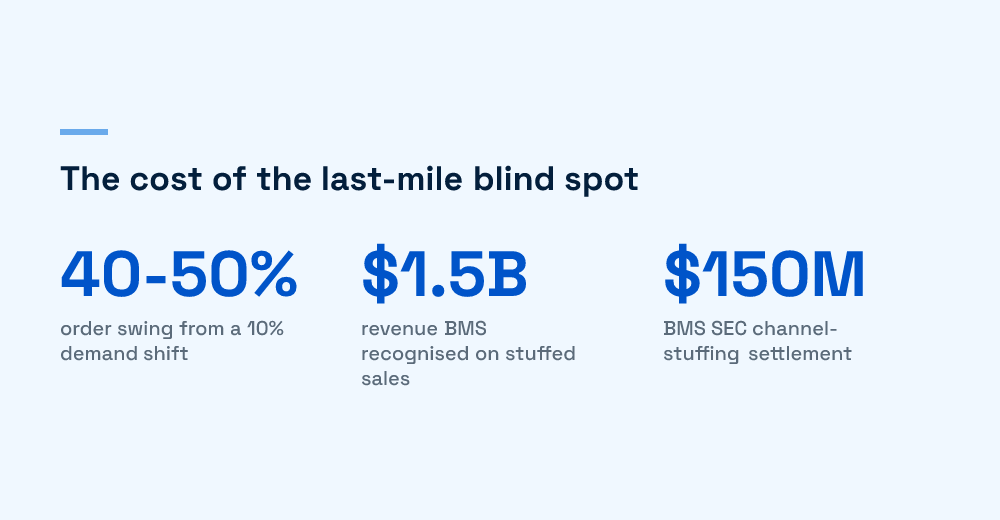
- The bullwhip effect turns a 10% demand shift at the shelf into a 40-50% swing upstream.
- When cumulative sell-in outruns sell-out by 20-30% for several periods, you are stuffing the channel, not selling.
- Distributors resist sharing sell-out data because it exposes them to disintermediation; the pipeline design has to price that in.
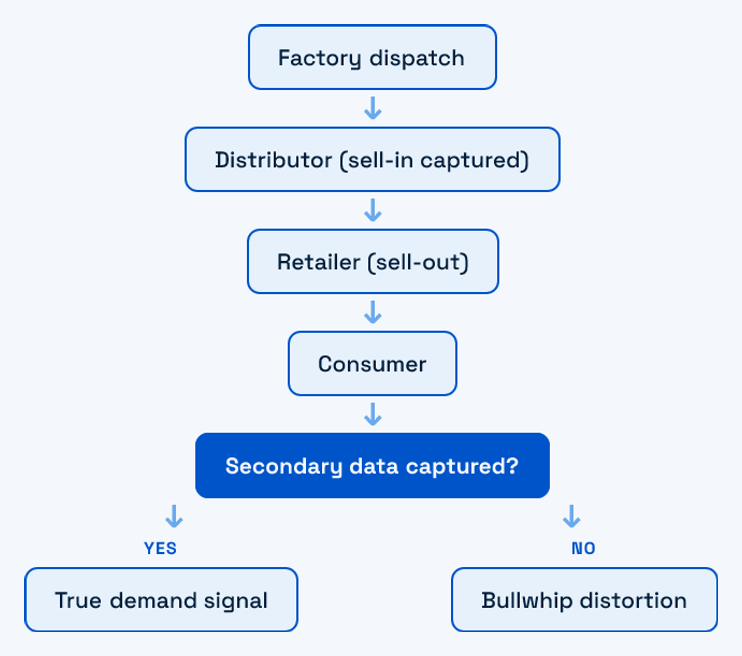
Primary sales data measures what you shipped into the channel. Secondary sales data measures what the channel sold onward, and only the second tracks real demand. Primary (sell-in) is billed from your own ERP, so it’s easy to trust. Secondary (sell-out) is recorded when the distributor sells to a retailer or pharmacy, so it lives in someone else’s systems. That gap is the last mile of distribution data, and it breaks first.
We’ve rebuilt these pipelines, and the failure is rarely where teams look for it. (For the full system view, layer by layer, see our complete guide to secondary sales automation.)
- Primary is push, secondary is pull. Sell-in reflects your targets and schemes; only sell-out reflects real demand.
- The bullwhip effect makes sell-in lie. A 10% demand shift can swell to a 40-50% swing upstream.
- Channel stuffing has a documented cost. Bristol-Myers Squibb settled SEC charges for $150 million.
- The last mile is hard by incentive, not tooling. Distributors guard sell-out data because sharing invites disintermediation.
- Reconcile, don’t just capture. A widening primary-to-secondary gap is inventory risk dressed as growth.
What is the difference between primary and secondary sales data?
Every unit sells twice: manufacturer to distributor (primary), then distributor to retailer (secondary). Same units, different signal. Primary is a push shaped by your targets; secondary is a pull reflecting real demand. Treat primary as a demand proxy and you’ve made a category error.
Sell-in is stock you convinced the channel to accept; sell-out is what it pulled through. They trade off cleanly:
| Dimension | Primary sales (sell-in) | Secondary sales (sell-out) |
|---|---|---|
| What it measures | Manufacturer to distributor shipment | Distributor to retailer or trade buyer |
| Signal type | Push: reflects targets and schemes | Pull: reflects actual offtake |
| Where it lives | Your ERP or billing system | Distributor tools, Tally, Excel, POS |
| Who controls it | You | A partner who may not want to share |
| Latency | Real time, it is your own invoice | Days to weeks, often reported late |
| Manipulation risk | High: stuffing looks like growth | Lower, but capture gaps distort it |
Why does the bullwhip effect make sell-in lie?
The gap is dangerous because of the bullwhip effect: order variability amplifies up a chain. Procter & Gamble coined the term after Pampers orders swung far more than diaper consumption did (MIT Sloan Management Review). Steady demand, unsteady orders.
Amplification does it. A retailer sees a 10% bump, adds a margin, orders 20% more. The distributor buffers again, 30% more. By the time it reaches raw-material suppliers, that 10% shift is a 40-50% swing (Finale Inventory). Every blind layer substitutes a guess, and guesses compound.
Lee and colleagues traced it to information distortion: decisions made on orders, not consumption, via forecast updating without downstream visibility, batching, promotions, and shortage gaming. Primary sits at the far end, so it’s a poor demand signal. Secondary is the antidote, the closest proxy to consumption short of point-of-sale everywhere.
What did channel stuffing cost Bristol-Myers Squibb?
Sell-in hiding weak sell-through has a documented price. From 2000 to 2001, Bristol-Myers Squibb pushed excess product to its two largest wholesalers and booked revenue on roughly $1.5 billion of it to look like it had hit Wall Street targets. The SEC charged channel stuffing; it settled for $150 million (U.S. Securities and Exchange Commission).
Primary looked like growth. Secondary, what wholesalers sold to pharmacies, didn’t keep pace, so inventory sat and the demand was fiction. This isn’t fringe: one review of 500-plus SEC accounting-fraud actions from 2014 to mid-2019 found improper revenue recognition the top category, at 43% (Zuckerman Law).
You don’t need fraud for the same distortion. Tie field-force incentives to distributor purchases instead of retailer offtake, and you’ve built legal channel stuffing into your comp plan. Reps optimise for sell-in; the returns arrive a quarter later.
Why is the last mile so hard to capture?
Most articles blame mess: data spread across Tally, Marg, Busy, and Excel, keyed by hand, reported late. That’s a symptom. The deeper reason: whoever holds the data has a rational reason not to hand it over. Distributors guard onward-sales data because it’s leverage.
Granular retailer-level offtake raises the fear of disintermediation, the brand going direct and cutting them out (Plytix). It isn’t bad tooling; it’s a partner protecting their position. Ignore that and you get a clean pilot and a stalled rollout. The projects that stick treat willingness to share as the first constraint, not the file format.
The mechanical problems on top are real too:
- System fragmentation. Every distributor bills in a different local tool that never syncs to your ERP.
- Master-data drift. One SKU carries three names across three distributors; outlet codes duplicate or are phantoms gaming scheme thresholds.
- Latency decay. Weekly Excel-and-WhatsApp data is often 7-10 days old; manual channels lag 20-30 days.
- Format churn. A software upgrade, a merged cell, a new template, and your parser breaks. A maintenance tax, not a one-time integration.
We’ve written before about automating secondary sales extraction across dozens of distributor file formats: the format problem is solvable but never finished, because inputs never stop changing. For teams weighing in-house versus a packaged tool, our build vs buy framework shows where the maintenance cost lands.
How do you reconcile primary and secondary data?
Capturing secondary data is half the job. Keep both datasets so they check each other, using a conservation identity every distribution stack should encode: Primary Sales = Secondary Sales + Closing Stock minus Opening Stock + Returns. Everything shipped in either sold onward, is still stock, or came back.
When a distributor’s numbers break that identity, something’s wrong: a missed report, a phantom outlet, an unlogged return. Put the rule in code you control, not a vendor’s black box. It’s the cheapest early-warning you have.
A widening primary-to-secondary gap is the channel-inventory buildup the Bristol-Myers case was made of, visible weeks before returns and expiries. When cumulative sell-in outpaces sell-out by more than 20-30% for several periods, inventory is piling up and demand inflated. The threshold depends on your category’s norms; the direction is the signal.
Where do secondary sales pipelines break in production?
Across the pipelines we’ve rebuilt, the same three failure modes recur, in order. None are model problems; they’re architecture and adoption problems.
The dashboard-first inversion
Teams build reporting first because it demos well, then find the ingestion beneath it is unreliable. A dashboard on shaky data launders bad numbers into confident charts. Build reliable intake first; the dashboard comes last.
The all-or-nothing file failure
One malformed row rejects a distributor’s whole monthly file, an ops person hand-fixes it under deadline, and the exception never gets designed for. The fix is row-level quarantine: flag the bad row, route it for review, let the rest through. One bad row halting the pipeline is a design defect. More in our pharma secondary-sales extraction pipeline and where it breaks.
The adoption gap at the point of capture
The most reliable secondary data comes from the rep entering the order at the outlet, same day. That happens only if the app is usable in real conditions: thirty visits a day, a patchy connection, a rep sold the tool as surveillance. Get it wrong and every downstream layer inherits guesswork. Trustworthy capture is really about designing UI for heavy data workflows people will actually use.
The pattern under all three: secondary capture gets treated as a data-engineering problem when it’s really that wrapped in an incentive problem wrapped in an adoption problem. Solve incentive and adoption first, and the last mile stops being where visibility dies.
If your primary chart looks healthy but your secondary picture is one you can’t quite trust, that gap is where the risk hides. We’ve done this before; the answer rarely starts with the pipeline. If that’s you, start a conversation, no pitch, just a look at where last-mile visibility breaks.
Frequently Asked Questions
What is the difference between primary and secondary sales data?
Primary sales data (sell-in) records the movement of goods from a manufacturer to a distributor and is captured when you invoice that distributor, so it lives in your own ERP and is easy to trust. Secondary sales data (sell-out) records the movement from the distributor onward to a retailer or trade buyer, so it lives in the distributor’s systems and is much harder to capture. The critical distinction is signal type: primary is a push signal shaped by your targets and trade schemes, while secondary is a pull signal that reflects what the market actually absorbed. If you want to know what you shipped, read primary sales; if you want to know what the market bought, you need secondary.
Why is secondary sales data harder to capture than primary sales data?
There are two layers. The obvious one is mechanical: secondary data sits outside your ERP, scattered across distributor tools like Tally, Marg, Busy, and Excel, often entered by hand and reported days or weeks late, with SKU names and outlet codes that drift constantly. The deeper reason is incentive-based: the distributor who holds the data has a rational motive not to share granular retailer-level offtake, because doing so raises the fear of disintermediation, that the brand will eventually go direct and cut them out. Any capture strategy that treats this as purely a format or tooling problem will produce a clean pilot and a stalled rollout, because the real constraint is the partner’s willingness to share.
How big a gap between primary and secondary sales is a red flag?
Use the reconciliation identity as your baseline: Primary Sales = Secondary Sales + Closing Stock minus Opening Stock + Returns. When cumulative primary sales run meaningfully ahead of secondary sales for several consecutive periods, inventory is accumulating in the channel and your reported demand is inflated. As a rough working threshold, a sell-in that consistently outpaces sell-out by more than about 20-30% is worth investigating rather than dismissing as seasonal. The exact number depends on your category’s normal stocking behaviour, but the direction matters more than the precise figure: a persistent, widening gap is channel-inventory risk that looks like growth on your revenue chart, and it typically surfaces as returns and expiries a quarter or two later.
What is channel stuffing and how does secondary sales data expose it?
Channel stuffing is pushing more inventory into the distribution channel than end demand justifies, usually to hit revenue or earnings targets, and then recognising that sell-in as revenue. Because primary sales are recorded the moment you invoice the distributor, the practice makes growth look strong on paper even when nothing is selling onward. Secondary sales data exposes it because it measures what the channel actually sold to retailers: when sell-in surges but sell-out stays flat, the stock is sitting in the channel, not moving to market. The Bristol-Myers Squibb case is the textbook example: the SEC found it recognised revenue on roughly $1.5 billion of products stuffed into its two largest wholesalers, and it settled for $150 million. Even without fraud, tying incentives to distributor purchases instead of retailer offtake builds the same distortion into a compensation plan.
How does the bullwhip effect relate to primary versus secondary sales?
The bullwhip effect is the tendency for order variability to amplify as it moves up a supply chain: a small change in consumer demand becomes a much larger swing in orders at each successive layer. Procter & Gamble named it after noticing that Pampers orders swung far more than actual diaper consumption. Primary sales sit at the far, amplified end of that chain, so they encode the channel’s buffered reactions rather than real consumption, which is exactly why they make a poor demand signal. Secondary sales data is the practical antidote: it is the closest reliable proxy to actual consumption you can get without point-of-sale at every till, so capturing it well dampens the whip instead of feeding it.

Huzefa Motiwala
Huzefa Motiwala is a co-founder of AlterSquare, an application-layer partner that helps SaaS and tech-led companies stabilise, modernise, and extend complex systems without breaking what already works. He comes at software from design and frontend, with a focus on data-heavy interfaces and on getting real teams to actually adopt what gets built — not just ship it. He writes about working in fragile, high-stakes codebases: incremental change over risky rewrites, UX and technical debt, and embedding AI into real workflows.






Leave a Reply